

TL;DR A falling returning customer rate looks like a retention problem. Usually it is not. We watched an Australian fashion label’s returning customer rate drop from 45.6% to 39.8% over twelve months while revenue grew 33% and new customers grew 54%. The ratio fell because the denominator grew faster than the numerator, which is exactly what healthy acquisition looks like. The same store also stopped discounting its evergreen range, and that mattered more than the discount percentage did. Meanwhile a different store we track saw the same ratio climb, and that one is now shrinking. Same metric, opposite meanings. Here is how to tell which one you are, in about two minutes.
Table of Contents
- What is a good returning customer rate?
- The store where it fell and everything got better
- The store where it rose and everything got worse
- Why a ratio lies in both directions
- What actually drove the growth
- It was not deeper discounting, the discounting changed shape
- The range told us where to push
- How to read your own two lines
- The bottom line
- FAQs
- Sources
Your returning customer rate is one of the easiest numbers to misread in ecommerce. It went down, so retention must be broken. It went up, so loyalty must be improving. Both of those readings are wrong about half the time.
We track one Australian fashion label whose returning customer rate fell almost six points last year. That store grew revenue 33%. We track another whose returning customer rate climbed nearly ten points over the same period. That store is now going backwards.
The number did not cause either outcome. It is a ratio, and a ratio can move for two completely different reasons.
What is a good returning customer rate?
There is no single good number, and anyone quoting you one is guessing. The rate is simply returning customers divided by total customers in a period, so it moves whenever either side moves.
That makes it useless on its own. A store with brilliant retention and no acquisition posts a beautiful rate right up until it runs out of customers to retain.
The useful question is not what the rate is. It is which side of the fraction is moving, and in which direction.
The store where it fell and everything got better
An Australian women’s fashion label, twelve months on the twelve before it.
| Metric | Change |
|---|---|
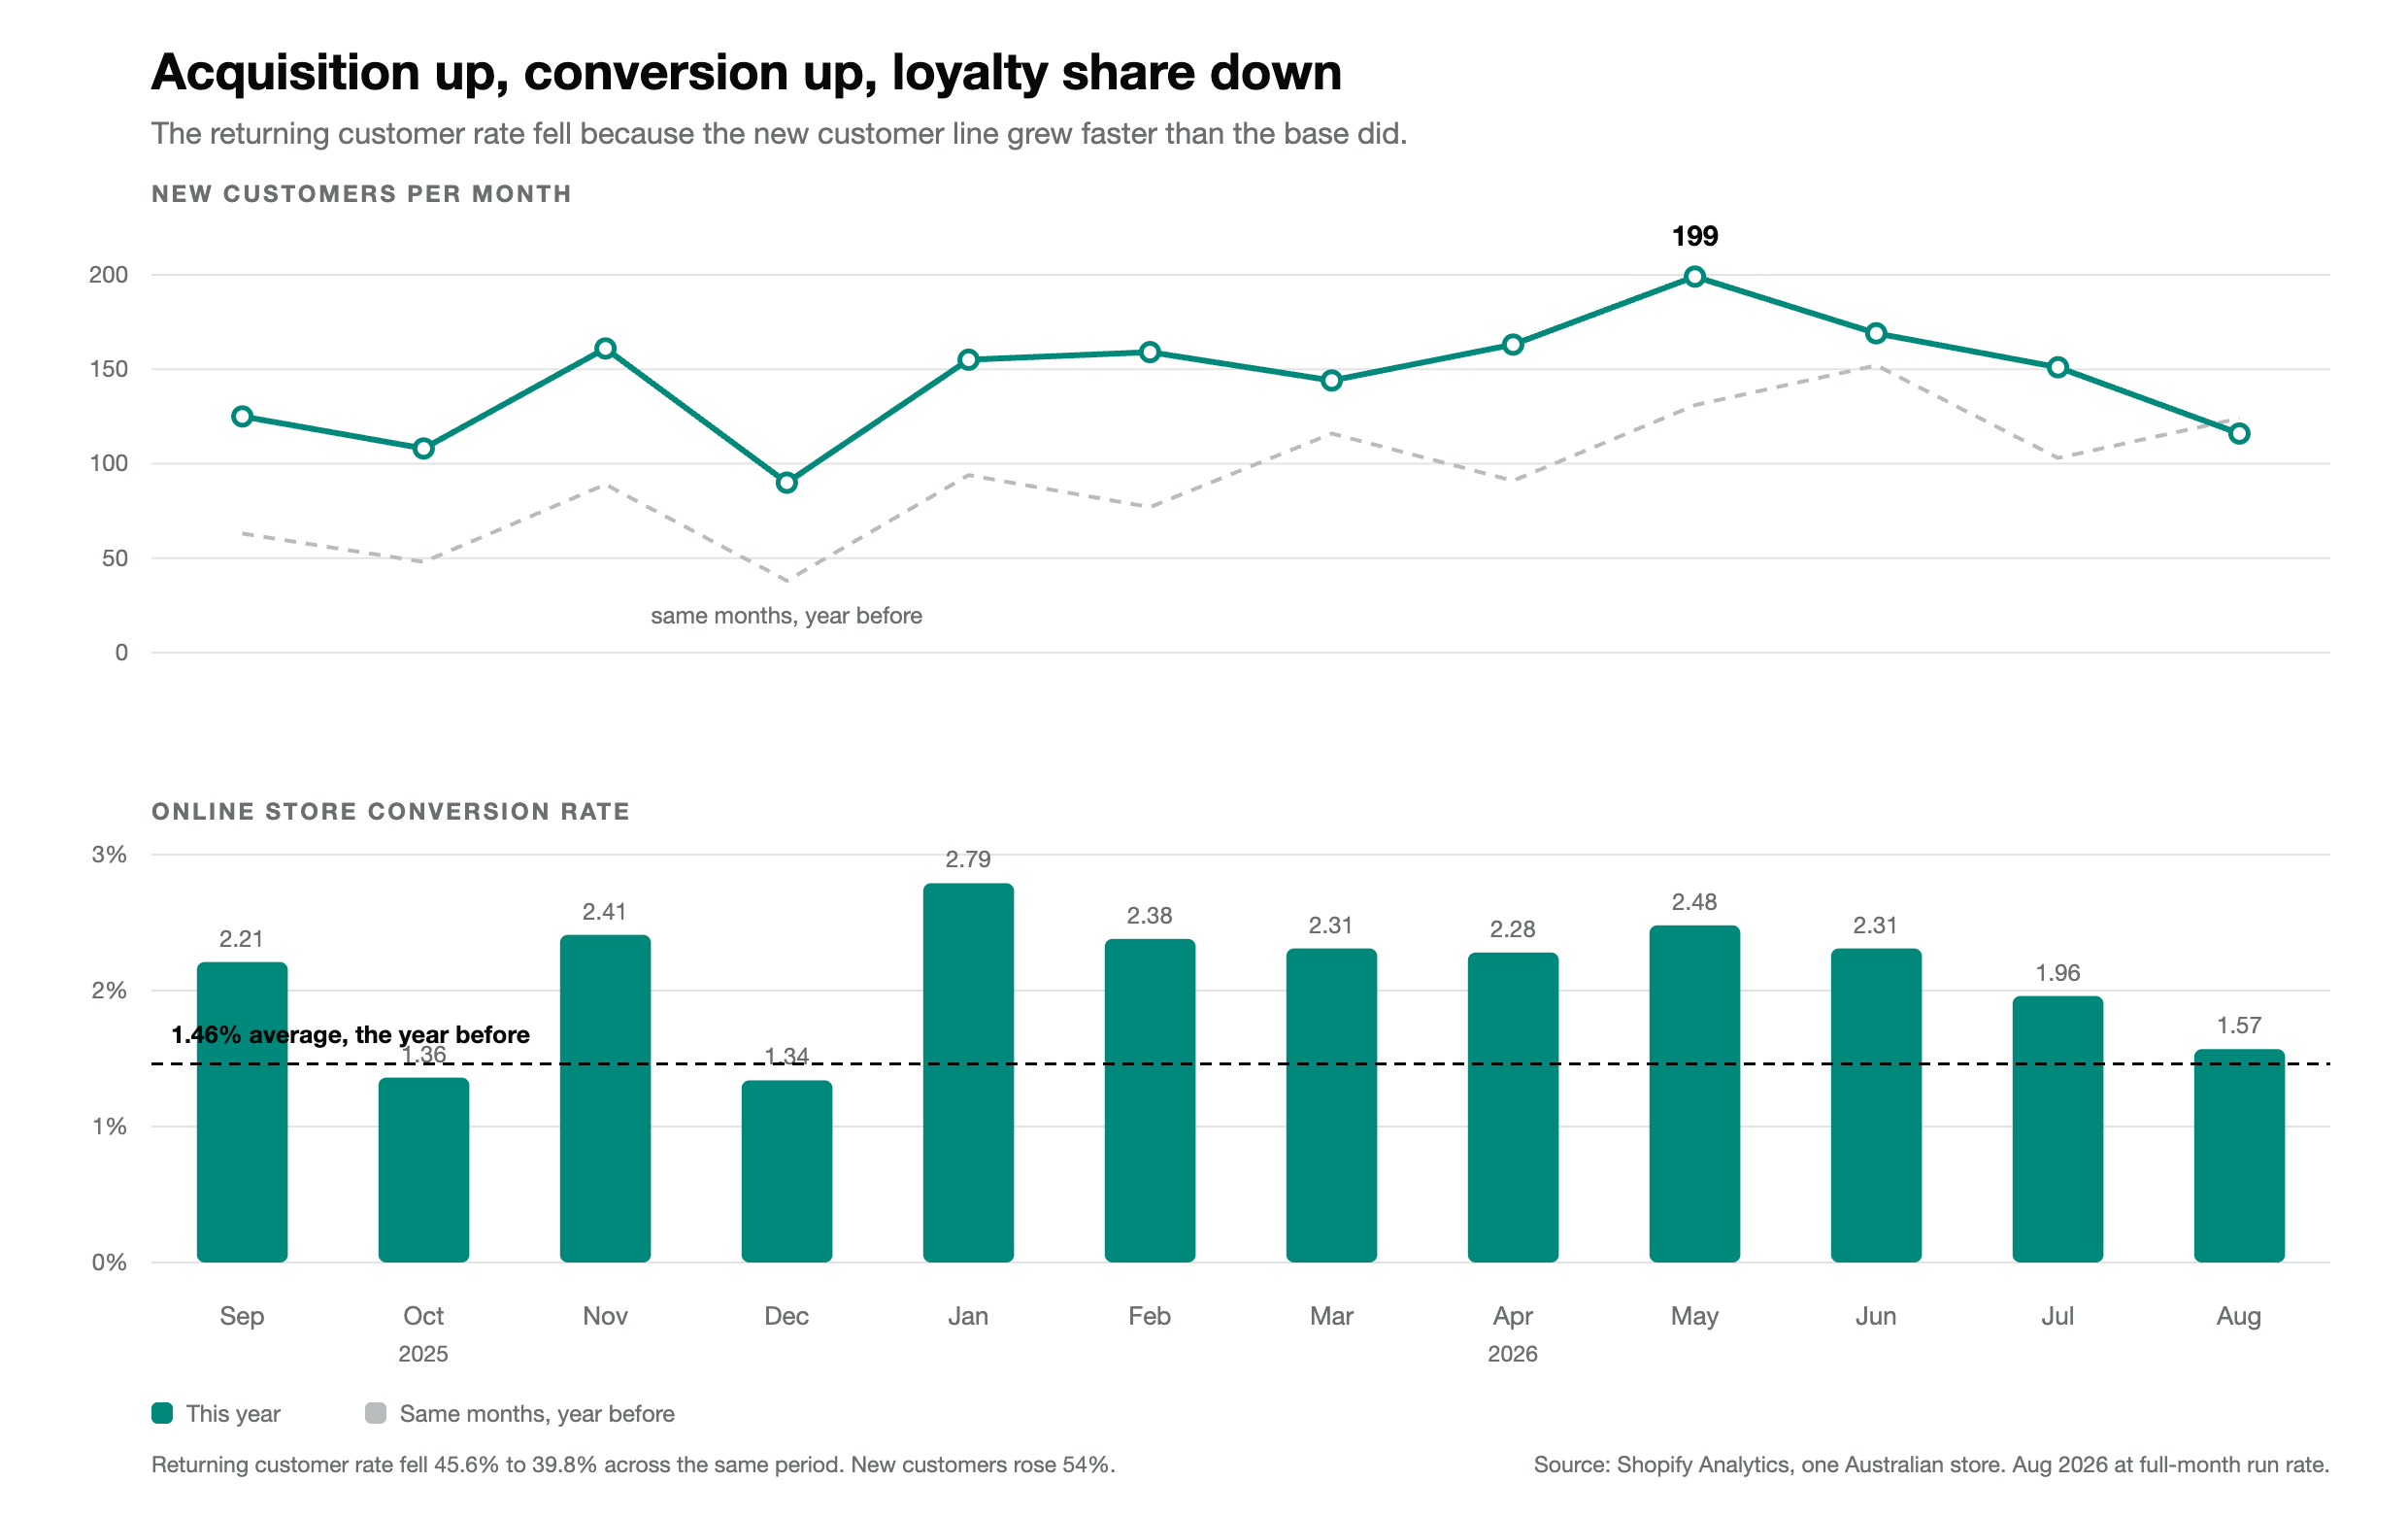
| Returning customer rate | 45.6% down to 39.8% |
| New customers | +54% |
| Returning customers | +22% |
| Net sales | +33% |
Read the middle two rows again. Returning customers went up 22%. The base did not shrink, it grew.
The rate fell because new customers grew more than twice as fast. That is not a retention problem. That is what acquisition working actually looks like on a report, and it looks like a decline.
The store where it rose and everything got worse
Now the other one. A haircare and beauty store, same twelve month window, all of it before they came to us.
| Metric | Change |
|---|---|
| Returning customer rate | 16.6% up to 26.2% |
| New customers | -8.5% |
| Returning customers | +64% |
| Net sales | +18% |
Every number in that table is green except one. Revenue grew. Loyalty appeared to improve dramatically.
But new customers went backwards, and by the end of the period that store’s monthly revenue had turned negative year on year. It spent a year living off its existing base. We wrote about how that happens in what a high ROAS actually costs you.
Why a ratio lies in both directions
Both stores moved the same metric. One moved it by growing the top of the funnel faster than the base. The other moved it by letting the top of the funnel shrink.
You cannot tell those apart from the ratio. You can only tell them apart by looking at the two raw counts underneath it.
| What you see | What it might mean | Check this |
|---|---|---|
| Rate falling | Healthy acquisition, or genuine churn | Is the returning count still rising? |
| Rate rising | Real loyalty, or a starved funnel | Is the new customer count falling? |
Two counts, thirty seconds, and the ambiguity is gone.
What actually drove the growth
It is worth being precise about where the fashion label’s 33% came from, because it was not the obvious levers.
It was not price. Average order value actually fell 7.5% across the period.
It was not deeper discounting either, though this is the part most people get wrong, so it is worth its own section below.
The measurable lever was conversion and traffic quality. Online store conversion rate rose 66%, from an average of 1.46% to 2.43%. Add to cart rate rose 36%. The store got materially better at turning the visitors it already had into buyers, and then acquisition scaled on top of that.
That order matters. Fix the rate first and every dollar of traffic you buy afterwards is worth more.
It was not deeper discounting. The discounting changed shape
Look only at the headline and you would conclude nothing changed. Discounts were 7.6% of gross sales in the earlier year and 8.1% in the later one.
The percentage barely moved. What moved was what got discounted.
| Type of discounting | Earlier year | Later year |
|---|---|---|
| Untargeted manual and bulk discounts, applied across the range | 67% of all discounting | 14% |
| Named, dated campaign and welcome codes | 2% | 54% |
| Largest single event, as a share of that month’s gross | 17.8%, a manual discount | 13.7%, a dated birthday sale |
In the earlier year the biggest discount line in the business was a manual, untargeted one. It came off evergreen product. The lines that were meant to hold their price all year were being marked down alongside everything else.
In the later year the biggest lines are a named seasonal campaign, a one off birthday event with a date attached, and a first order welcome offer. Clearance is handled as its own separate thing rather than blended into the range.
That distinction is the whole argument. Discounting evergreen product teaches your customer that the real price is lower and they should wait. You do not get that position back cheaply. Discounting clearance costs you nothing, because the customer understands why it is cheaper. A dated event costs you nothing either, because it ends.
Two stores can both run 8% and be doing opposite things to their brand. The percentage is not the number to watch. The composition is.
The range told us where to push
The product data made the direction obvious once we looked at it properly. The apparel line carried almost all of the growth.
| Product line | Year on year |
|---|---|
| Linen pants, hero line | +140% |
| Linen tunic, second line | +180% |
| Two further linen styles | +130% and +155% |
| Best selling uniform SKU | +17% |
| Second uniform SKU | -45% |
The uniform range was the business the store was known for. The apparel range was the business it was becoming. Reading the returning customer rate would never have told you that. Reading the product mix did.
The other thing the data showed, and this is the boring one that matters most, is that the growth lines were in stock. Roughly twenty thousand units on hand across the range. You cannot scale a winner you cannot ship.
How to read your own two lines
Open Shopify, go to Analytics, then Reports, then New versus returning customers. Set it to monthly across the last 24 months.
Ignore the rate. Ignore revenue. Read the two customer counts side by side and ask one question. Are they both growing?
Both growing means you are compounding, whatever the ratio between them is doing. New falling while returning holds means you are harvesting, and you have about a quarter before it shows up in revenue. Both falling means you already know.
The bottom line
- A returning customer rate is a ratio, so it moves for two opposite reasons
- Falling can mean acquisition is outrunning your base, which is good
- Rising can mean your funnel is starving, which is not
- The two raw counts underneath tell you which, and the rate never will
- On discounting, the composition matters far more than the percentage
If you want a straight read on which of those two stores yours currently resembles, that is a twenty minute conversation and you will know either way. No pressure, no obligation and no sales pitch. If we would not do it in our own business, we will not recommend it in yours.
FAQs
What is a good returning customer rate for an ecommerce store? There is no universal number. A healthy rate is one where both the new and returning customer counts are growing, whatever ratio that produces. A store at 40% with both lines rising is healthier than a store at 60% with new customers falling.
Why did my returning customer rate go down? Usually because you acquired more new customers, not because you lost old ones. Check whether your returning customer count also rose. If it did, the rate fell for a good reason.
Is a high returning customer rate always good? No. A high rate can mean strong loyalty, or it can mean you have stopped bringing new people in and your existing base is all that is left. Check your new customer count before you celebrate it.
How do I improve my ecommerce conversion rate? Start with the pages your traffic already lands on rather than the ad account. The store above lifted conversion 66% and add to cart 36% without raising prices or discounting harder, which then made every acquisition dollar spent afterwards worth more.
Should I discount to grow revenue? Not on your evergreen range. The store above grew 33% while total discounting stayed near 8% of gross, but it shifted from untargeted markdowns across the range to dated campaigns, a welcome offer and separate clearance. Composition matters more than percentage.
Sources
- First-party Shopify reporting from an Australian women’s fashion label, 24 months to August 2026, used with permission and reported unnamed. Figures are net sales, orders, discounts, conversion rate and new versus returning customer counts as shown in Shopify Analytics. The discount composition split is built from named discount codes in the Sales by discount codes report and is directional rather than exhaustive, since codes outside the named set are not attributed by month.
- First-party Shopify reporting from an Australian haircare and beauty store, same period, reported unnamed. That period predates BRANDLOCKER’s involvement with the store.
- BRANDLOCKER, What Is A Good ROAS? Not 12, And Here Is Why (2026): brandlocker.com.au


