

TL;DR A protected ROAS target tells the platform to buy only the cheapest conversions available, and the cheapest conversions are the people who already know you. The number stays beautiful while the top of your funnel quietly empties. We tracked an Australian store doing exactly that for a year. Its new customer count fell 45% in five months, revenue did not move for the first three, and then it fell off a cliff. Here is the lag, why a profitable channel got switched off, and the ninety second check you can run on your own store today.
Table of Contents
- What is a good ROAS, and why 12 is a warning
- What a target ROAS actually tells the platform to do
- The store that looked healthy for a year
- The lag that hides the damage
- The profitable channel that got switched off
- The ninety second check on your own store
- What to do instead of chasing a good ROAS
- The bottom line
- FAQs
- Sources
Ask ten store owners what a good ROAS is and you will get ten numbers, all of them higher than the last. Four is respectable. Eight is a good month. Twelve gets a screenshot in the group chat.
I want to make the opposite argument. A high ROAS is rarely evidence you are winning. It is usually evidence you are buying too little, and the invoice for that does not arrive for about six months.
We watched it happen to an Australian haircare and beauty store across the last twelve months. Every decision described below was made before they came to us, so this is a diagnosis of what we found rather than an account of anything we ran. Nothing in it looked broken at any point. That is exactly the problem, and it is why this one is so easy to miss.
What is a good ROAS, and why 12 is a warning
There is no universal good ROAS. A good ROAS is one that clears your contribution margin while still bringing in new customers at the volume your business needs. That second half is the part almost nobody measures.
Read on its own, a return of 12 tells you one thing only, which is that the conversions you bought were cheap relative to their value. It does not tell you how many you turned down to get there.
A store at 12 that is losing new customers every month is performing worse than a store at 4 that is growing its base. One of them is harvesting. The other is farming.
What a target ROAS actually tells the platform to do
Set a target return and you have not asked Google for more sales. You have asked it for a price.
At a high target the algorithm can only clear the bar by entering the auctions it is most confident about. Branded searches. Someone who has visited three times. A cart sitting open on another device. It buys the sure thing and declines anything with doubt in it.
Those conversions were mostly going to happen anyway. So the return looks superb, because you are paying a small toll on demand you already created somewhere else.
Google says this in its own documentation, plainly. Setting a target that is too high, in their words, “may limit the amount of traffic your ads may get.” Their recommended fix for more volume is to lower the target so the strategy can enter more auctions.
A high target ROAS is a volume cap that reports itself as a performance win.
The store that looked healthy for a year
Twelve months of trading. Net sales up 18% year on year. Average order value up. Returning customer rate climbed from 16.6% to 26.2%, which every dashboard on earth will render in green.
Underneath the headline, this.
| Twelve months on twelve months | Change |
|---|---|
| Net sales | +18% |
| Returning customers | +64% |
| New customers | -8.5% |
Every dollar of that growth came out of the existing customer base. The top of the funnel went backwards while the business got bigger.
That works. It works right up until it does not, because a returning customer base is a battery and nobody was charging it.
The lag that hides the damage
Here is what makes this so hard to see from the inside. The decision and the symptom are two quarters apart.
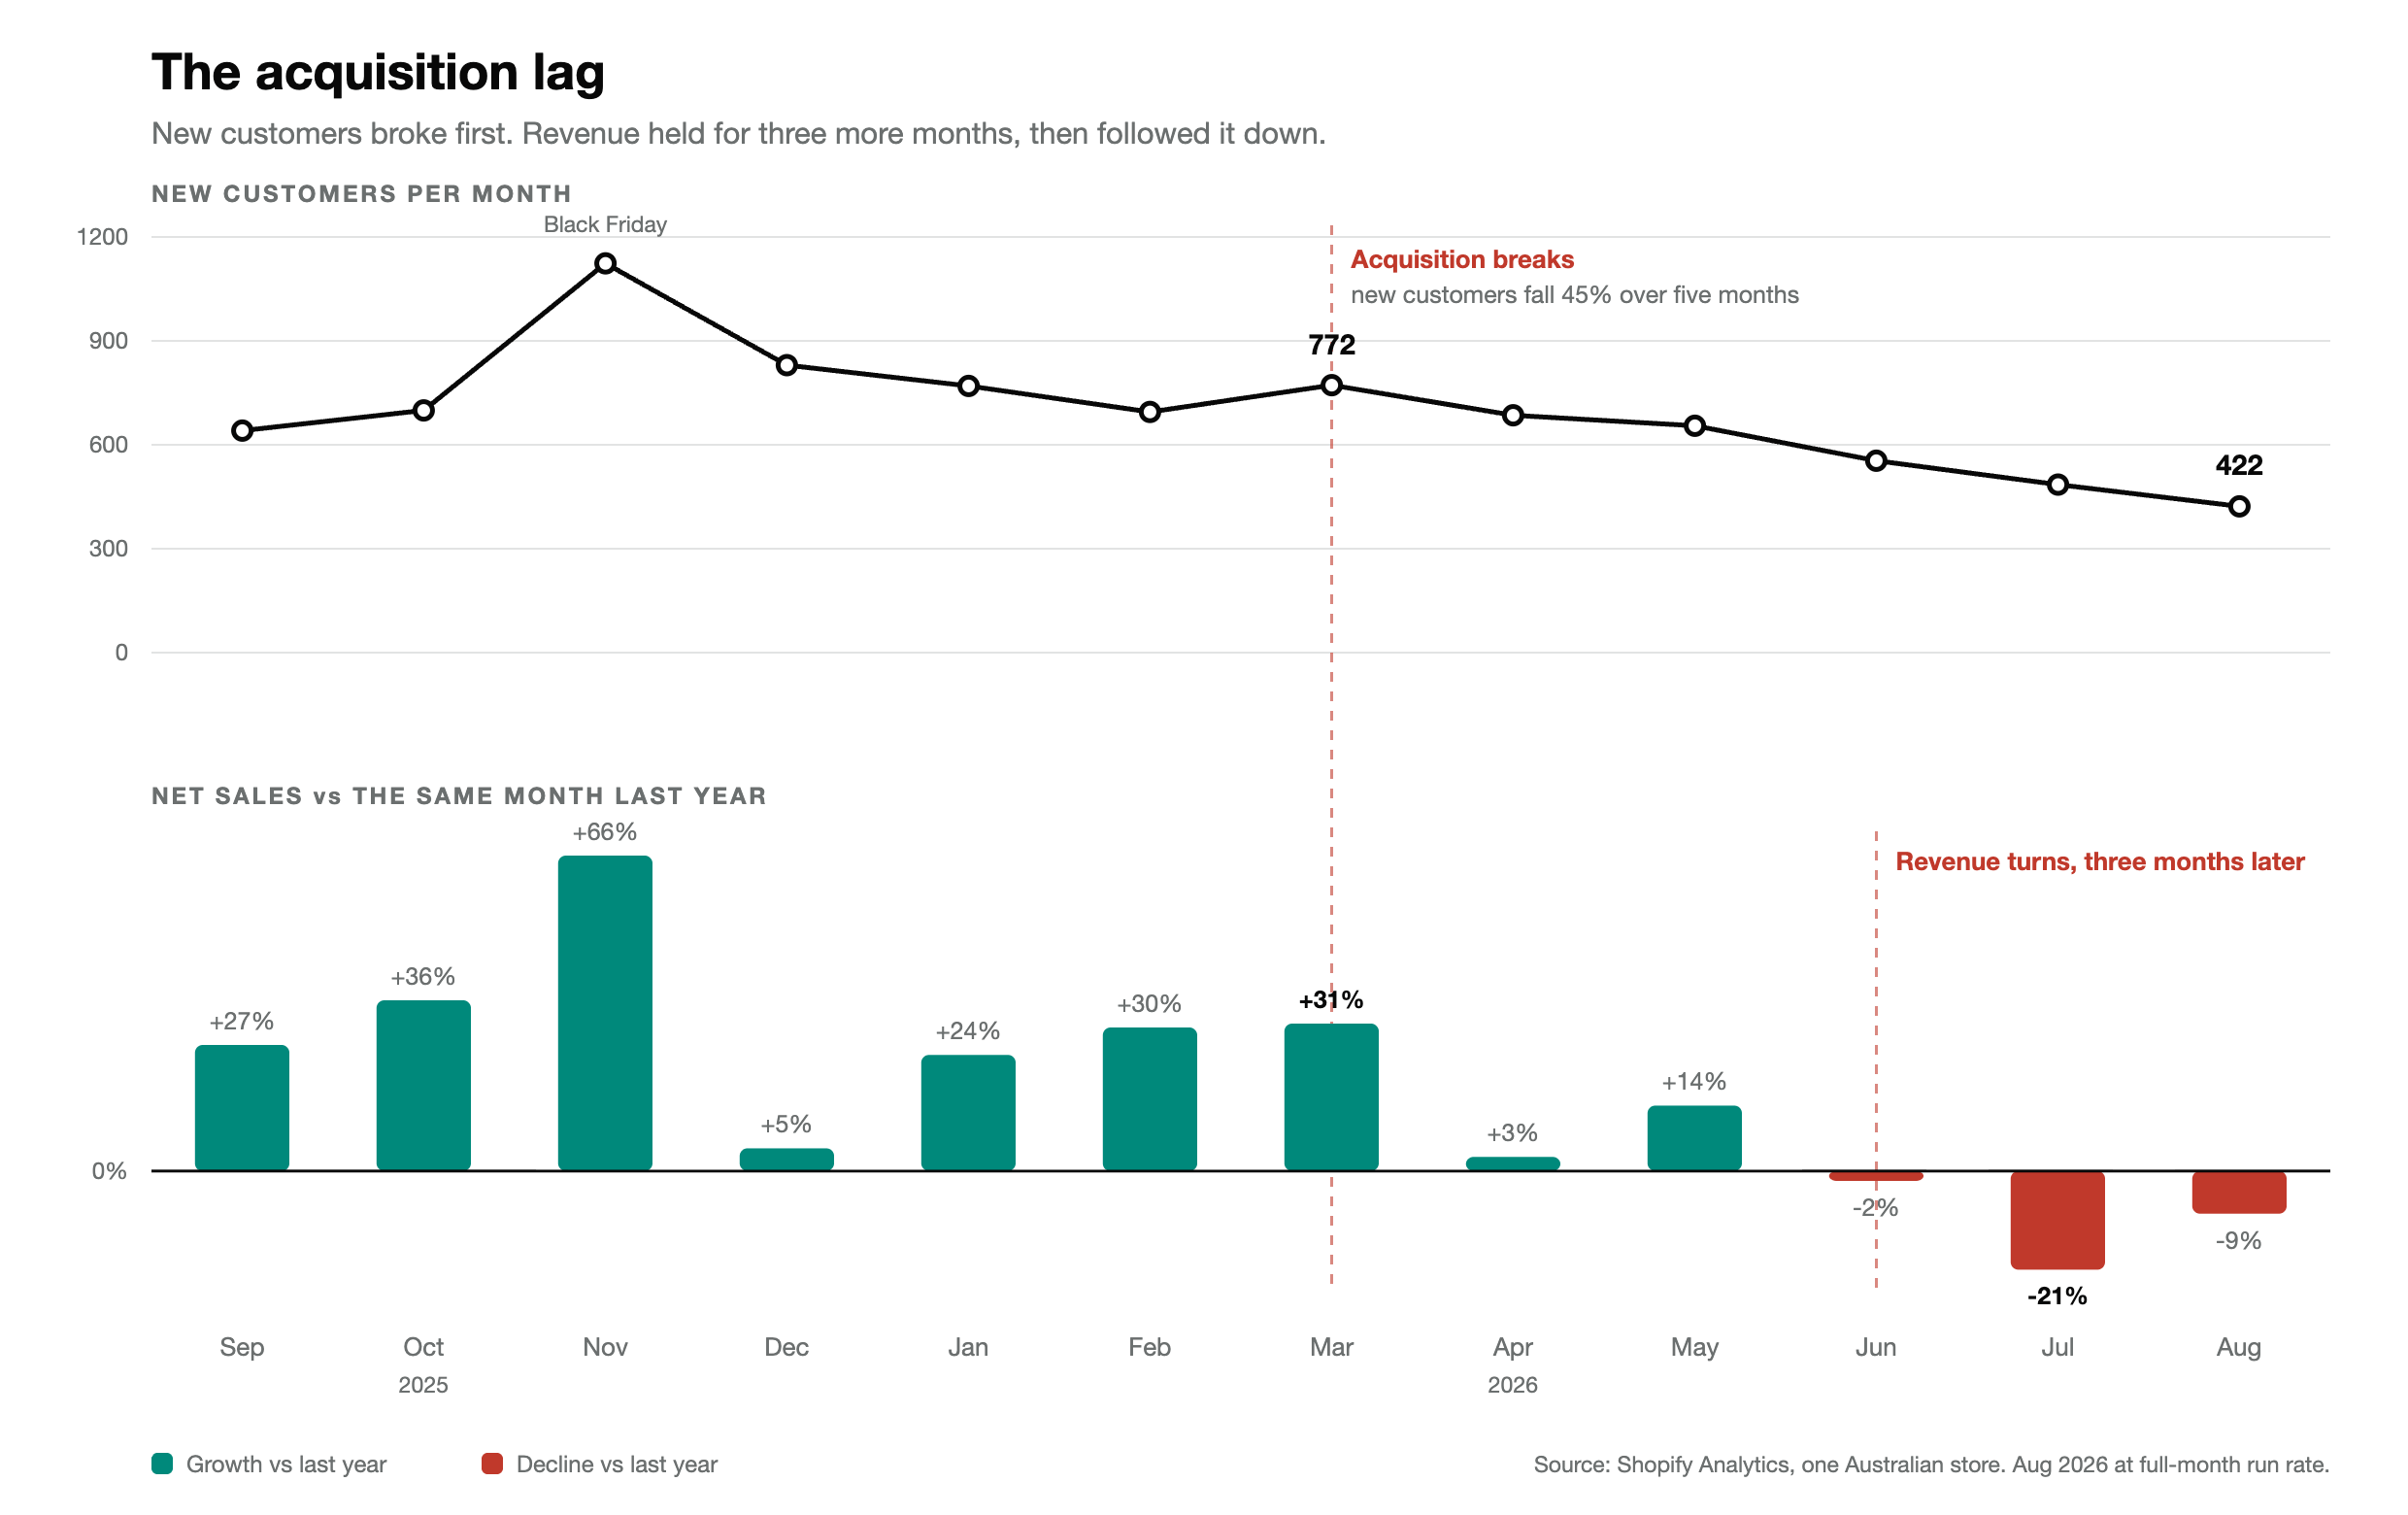
| Month | New customers | Net sales vs same month last year |
|---|---|---|
| March | 772 | +31% |
| April | 685 | +3% |
| May | 655 | +14% |
| June | 554 | -2% |
| July | 485 | -21% |
| August | 422 | -9% |
New customer acquisition broke in March. Revenue held for three more months, because the returning base carried it. By July the battery was flat and the year on year line was down 21%.
If you review your account monthly, and everyone does, you saw four normal months and then a bad one. Nothing that happened in July caused July.
There is a second tell in the discounting. This store ran at about 3% of gross sales in discounts through the first quarter. From June it has run at 7% and it is leaning on scarcity codes to do it. That is a business propping up a falling order count with margin, which buys you a month and costs you a year.
The profitable channel that got switched off
The second half of this story is worse, and far more common than the first.
The same store had a paid social channel returning around 11. They turned it off.
Not because it failed. Because their own analytics attributed almost nothing to marketing across the entire twelve months. When the ad platform reports 11 and your own store reports close to zero, most owners believe the store. That instinct is reasonable, and here it was expensive. That call, like the target above it, was made before we were involved.
Search captures demand that already exists. Social creates demand that does not. Switch off the channel doing the creating and search keeps performing beautifully for a few months, harvesting a field nobody is planting any more.
The channel did not get cut because it was losing money. It got cut because it could not prove it was making any. That is a measurement problem wearing a media problem’s clothes, and the two get confused constantly.
The ninety second check on your own store
Do this before you touch anything else, and do not look at revenue while you do it.
Open Shopify, go to Analytics, then Reports, then New versus returning customers. Set it to monthly across the last 24 months. Ignore every revenue column and read the new customer count on its own.
If that line has been falling for three months while your revenue holds steady, you are living off your base. On the evidence above you have roughly one quarter before it reaches the number your accountant cares about.
That is the whole diagnostic. It costs ninety seconds and it is the earliest warning signal you get.
What to do instead of chasing a good ROAS
- Judge the account on new customer cost, not blended return. Blended return will always flatter you, because it includes people you never had to buy in the first place.
- Treat your target ROAS as a dial, not a setting. If you are sitting high and your new customer line is falling, lower the target deliberately and watch what volume it unlocks. You are trading a number nobody pays you for against customers who will buy again.
- Fix measurement before you cut a channel. A channel you cannot see is not the same thing as a channel that is not working. Confusing the two cost this store about six months of growth.
- Then go and look at your shelves. In this store’s case one product family that did roughly $125,000 last year did $64,000 this year, and every colourway in it is out of stock today while the collection page still pulls thousands of visits a year into nothing. Traffic was never the constraint.
The bottom line
- A high ROAS often means you are buying only the demand you already made
- Revenue lags acquisition by roughly a quarter, which is why this gets caught late
- Growth from returning customers alone has a ceiling, and you will hit it
- A channel you cannot measure is not the same as a channel that does not work
If you want a straight read on whether your growth is coming from new customers or from your existing base, that is a twenty minute conversation and you will know either way. It is a relaxed chat about where you are winning and where you are quietly going backwards, with no pressure, no obligation and no sales pitch. If we would not do it in our own business, we will not recommend it in yours.
FAQs
What is a good ROAS for an ecommerce store? There is no universal number. A good ROAS is one that clears your contribution margin while still buying new customers at the volume you need. A store at 12 losing new customers is performing worse than a store at 4 growing its base.
Does a high ROAS mean my ads are working? Not on its own. A high return often means you are capturing demand you created elsewhere rather than creating new demand. Check whether your new customer count is growing before you call it a win.
Should I lower my target ROAS? Lower it if your new customer count is falling while revenue holds. Google’s own guidance is that reducing the target lets the bid strategy enter more auctions. Move in steps, watch new customer volume rather than blended return, and stop when a new customer costs more than they are worth to you.
Why did my sales drop months after everything looked fine? Revenue from returning customers lags acquisition by around a quarter. If you stopped bringing new customers in, your existing base carries the number for a few months before the decline becomes visible in your reporting.
Should I trust my ad platform or my Shopify analytics? Neither on its own. Platforms over-claim and store analytics under-claim, especially where tracking is incomplete. Judge a channel by what happens to total new customers when you turn it on and off, not by either report in isolation.
Sources
- Google Ads Help, About Target ROAS bidding: support.google.com
- First-party Shopify reporting from an Australian haircare and beauty store, 24 months to August 2026, used with permission and reported unnamed. The period described predates BRANDLOCKER’s involvement with the store. Figures are net sales, orders and new versus returning customer counts as shown in Shopify Analytics.


